WordPress网页还在使用Excel / MatPlotLib图片展示数据?在网页中以HTML的形式引用Echarts会有更好的效果。
1 安装所需插件
在WordPress的插件商店中安装【amCharts: Charts and Maps】插件。用的是Echarts,却安装了amCharts的插件,是因为没有Echarts对应插件这一插件提供了编辑图表HTML代码块的功能,而且能快捷生成可以直接在文章或页面中引用的短代码。

2 插件设置
注:如果选择在HTML代码中直接引用所需js源(Echarts官网下载的HTML代码就是这一形式),此步骤可跳过。
在网站后台【设置】中选择【Charts & Maps】进入插件设置界面,在【Custom Resources】中添加Echarts的js源:
//echartsjs.com/gallery/vendors/echarts/echarts.js
//echarts.baidu.com/gallery/vendors/echarts/echarts.min.js
//echarts.baidu.com/gallery/vendors/echarts-gl/echarts-gl.min.js
//echarts.baidu.com/gallery/vendors/echarts-stat/ecStat.min.js
//echarts.baidu.com/gallery/vendors/echarts/extension/dataTool.min.js
//echarts.baidu.com/gallery/vendors/echarts/map/js/china.js
//echarts.baidu.com/gallery/vendors/echarts/map/js/world.js
//api.map.baidu.com/api?v=2.0&ak=ZUONbpqGBsYGXNIYHicvbAbM
//echarts.baidu.com/gallery/vendors/echarts/extension/bmap.min.js
//echarts.baidu.com/gallery/vendors/simplex.js
3 获取Echarts图代码
Apache Echarts:
https://echarts.apache.org/zh/index.html
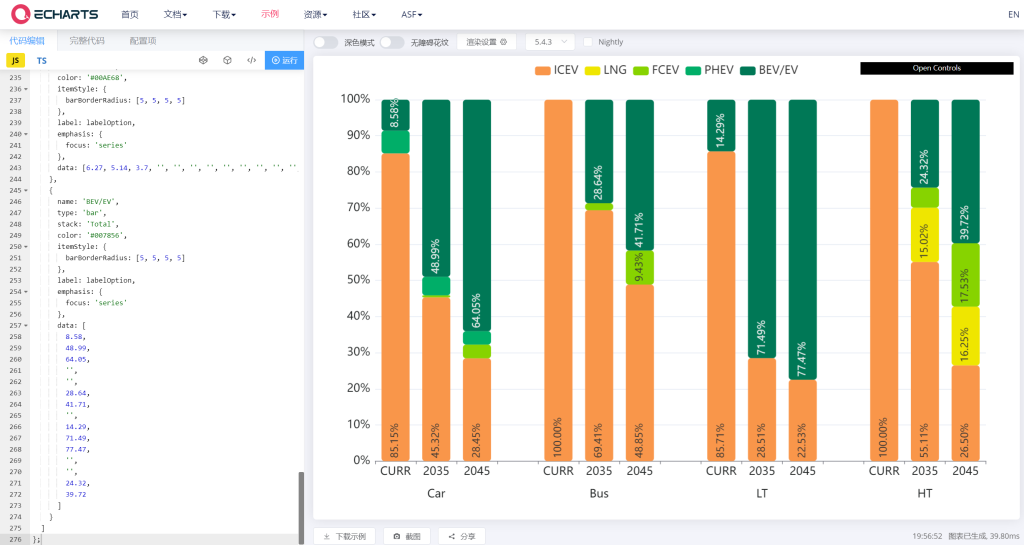
官网的同步可视化编辑界面做的很好,博主一般喜欢直接在这里编辑。以某幅堆叠柱形图(展示某地区不同车种能源结构演变趋势)为例(图内数据已被博主刻意篡改,无实际意义):

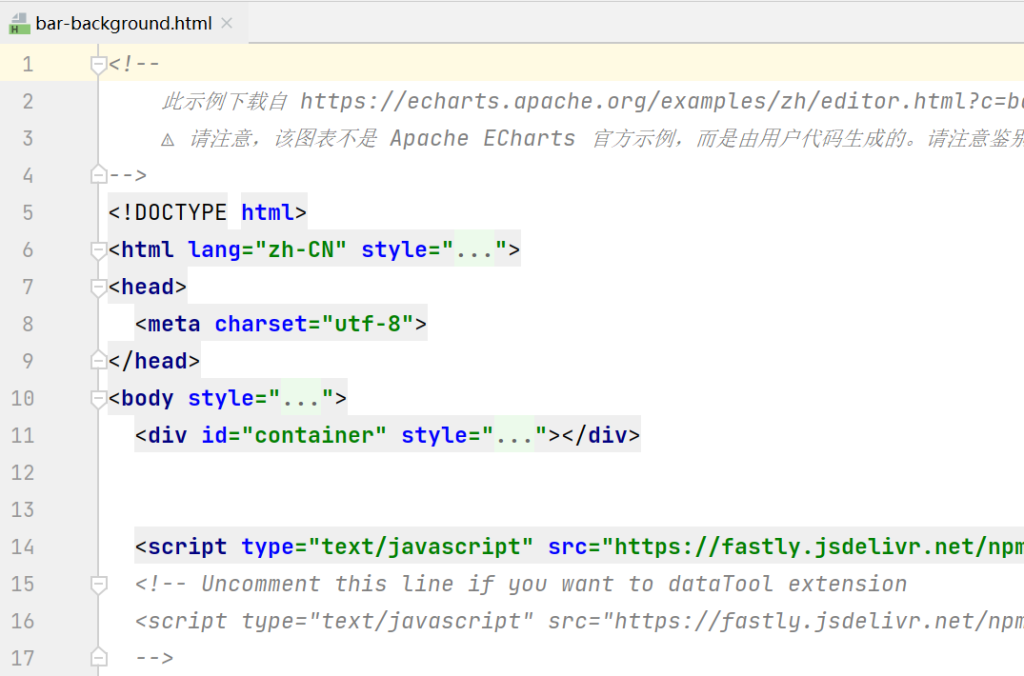
编辑完成后,使用【下载示例】导出.html文件,用能查看代码的任意程序(比如博主用的是IDEA)打开或者用万能的.txt大法,有奇效,类似于如下效果:

这样就方便把代码迁移到插件里了。
4 在插件里新建图
在网站后台【Charts & Maps】中选择【Add New】(注意和刚才的设置不在同一位置),填写图标题和HTML代码,Echarts官网给的原始代码通常会包括引用js源(如本例是引用了https://fastly.jsdelivr.net/npm/echarts@5.4.3/dist/echarts.min.js,这也是绝大多数Echarts图会用到的唯一js源)和嵌入式的图js代码,所以此处可以不编辑【Resources】和【JavaScript】框。倘若有特殊情况,请特殊处理。
但需要注意的是,原始代码直接编译,后续会使得图的高度出现问题,所以此处需要进行一些修改。
4.1 设置父元素的高度
为图的父元素设置一个固定的高度,比如600px:
<div id="myChart" style="height: 600px;"></div>这段代码使用新的图表元素引用div id="myChart"替换原始代码中的图表元素引用div id="container"。
4.2 在Echarts的初始化选项中设置高度
在JavaScript中初始化Echarts图表时,在选项中设置图表的高度,比如依然使用600px顶格:
var myChart = echarts.init(document.getElementById('myChart'), null, {height: 600});这段代码使用图表参数新myChart替换原始代码中的图表参数dom和旧myChart。
4.3 修改后的HTML代码
经过上述两轮修改后,本例的HTML代码如下。这段代码可以直接放入【HTML】框中。
<!DOCTYPE html>
<html lang="zh-CN" style="height: 100%">
<head>
  <meta charset="utf-8">
</head>
<body style="height: 100%; margin: 0">
  <div id="myChart" style="height: 600px;"></div>


  <script type="text/javascript" src="https://fastly.jsdelivr.net/npm/echarts@5.4.3/dist/echarts.min.js"></script>
  <script type="text/javascript">
    var myChart = echarts.init(document.getElementById('myChart'), null, {height: 600});
    var app = {};

    var option;

    const posList = [
  'left',
  'right',
  'top',
  'bottom',
  'inside',
  'insideTop',
  'insideLeft',
  'insideRight',
  'insideBottom',
  'insideTopLeft',
  'insideTopRight',
  'insideBottomLeft',
  'insideBottomRight'
];
app.configParameters = {
  rotate: {
    min: -90,
    max: 90
  },
  align: {
    options: {
      left: 'left',
      center: 'center',
      right: 'right'
    }
  },
  verticalAlign: {
    options: {
      top: 'top',
      middle: 'middle',
      bottom: 'bottom'
    }
  },
  position: {
    options: posList.reduce(function (map, pos) {
      map[pos] = pos;
      return map;
    }, {})
  },
  distance: {
    min: 0,
    max: 100
  }
};
app.config = {
  rotate: 90,
  align: 'left',
  verticalAlign: 'middle',
  position: 'insideBottom',
  distance: 5,
  onChange: function () {
    const labelOption = {
      rotate: app.config.rotate,
      align: app.config.align,
      verticalAlign: app.config.verticalAlign,
      position: app.config.position,
      distance: app.config.distance
    };
    myChart.setOption({
      series: [
        {
          label: labelOption
        },
        {
          label: labelOption
        },
        {
          label: labelOption
        },
        {
          label: labelOption
        }
      ]
    });
  }
};
const labelOption = {
  show: true,
  position: app.config.position,
  distance: app.config.distance,
  align: app.config.align,
  verticalAlign: app.config.verticalAlign,
  rotate: app.config.rotate,
  formatter: function (params) {
    if (params.value > 8) {
      return params.value.toFixed(2) + '%';
    } else {
      return '';
    }
  },
  fontSize: 13,
  rich: {
    name: {}
  }
};

option = {
  textStyle: {
    color: '#212424',
    fontFamily: 'Microsoft YaHei, sans-serif',
    fontWeight: ''
  },
  tooltip: {
    trigger: 'axis',
    axisPointer: {
      type: 'shadow'
    },
    valueFormatter: function (value) {
          return value + '%';
    }
  },
  legend: {
    textStyle: {
      fontSize: 14
    }
  },
  grid: {
    left: '3%',
    right: '4%',
    bottom: '3%',
    containLabel: true
  },
  xAxis: [
    {
      type: 'category',
      data: [
        'CURR',
        '2035\n\nCar',
        '2045',
        '',
        'CURR',
        '2035\n\nBus',
        '2045',
        '',
        'CURR',
        '2035\n\nLT',
        '2045',
        '',
        'CURR',
        '2035\n\nHT',
        '2045'
      ],
      axisLabel: {
        fontSize: 12
      }
    }
  ],
  yAxis: [
    {
      type: 'value',
      interval: 10,
      axisLabel: {
        formatter: '{value}%',
        fontSize: 14
      }
    }
  ],
  series: [
    {
      name: 'ICEV',
      type: 'bar',
      stack: 'Total',
      color: '#F9964A',
      itemStyle: {
        barBorderRadius: [5, 5, 5, 5]
      },
      label: labelOption,
      emphasis: {
        focus: 'series'
      },
      data: [
        85.15,
        45.32,
        28.45,
        '',
        100,
        69.41,
        48.85,
        '',
        85.71,
        28.51,
        22.53,
        '',
        100,
        55.11,
        26.5
      ]
    },
    {
      name: 'LNG',
      type: 'bar',
      stack: 'Total',
      color: '#EFE600',
      itemStyle: {
        barBorderRadius: [5, 5, 5, 5]
      },
      label: labelOption,
      emphasis: {
        focus: 'series'
      },
      data: ['', '', '', '', '', '', '', '', '', '', '', '', '', 15.02, 16.25]
    },
    {
      name: 'FCEV',
      type: 'bar',
      stack: 'Total',
      color: '#87D300',
      itemStyle: {
        barBorderRadius: [5, 5, 5, 5]
      },
      label: labelOption,
      emphasis: {
        focus: 'series'
      },
      data: [
        0,
        0.55,
        3.8,
        '',
        0,
        1.95,
        9.43,
        '',
        '',
        '',
        '',
        '',
        0,
        5.55,
        17.53
      ]
    },
    {
      name: 'PHEV',
      type: 'bar',
      stack: 'Total',
      color: '#00AE68',
      itemStyle: {
        barBorderRadius: [5, 5, 5, 5]
      },
      label: labelOption,
      emphasis: {
        focus: 'series'
      },
      data: [6.27, 5.14, 3.7, '', '', '', '', '', '', '', '', '', '', '', '']
    },
    {
      name: 'BEV/EV',
      type: 'bar',
      stack: 'Total',
      color: '#007856',
      itemStyle: {
        barBorderRadius: [5, 5, 5, 5]
      },
      label: labelOption,
      emphasis: {
        focus: 'series'
      },
      data: [
        8.58,
        48.99,
        64.05,
        '',
        '',
        28.64,
        41.71,
        '',
        14.29,
        71.49,
        77.47,
        '',
        '',
        24.32,
        39.72
      ]
    }
  ]
};

    if (option && typeof option === 'object') {
      myChart.setOption(option);
    }

    window.addEventListener('resize', myChart.resize);
  </script>
</body>
</html>
5 在文章中插入图
插件会给新建图生成一个新的短代码,可以直接引用。在网页后台【Charts & Maps】首页可以查看:

引用效果如下:
6 后续调试
因为某种不明问题,导致无法在图的代码块中继续使用<head>和<body>,否则网页将出现Echarts图和部分元素无法正常加载的情况。此时删去上述绘图代码块中的html、head和body容器即可使图再次正常显示。
但这里会出现一个新问题:代码都修改成这样了,直接用古腾堡编辑器的【自定义html】区块引用图表不是更省事?博主还是认为,使用外部代码块管理工具(不管是amCharts还是Code Snippets云云)依然更加符合工程需要,不需要每次修改都进入文章编辑界面。


